In mathematics, we use symbols to denote relations and we build mathematical sentences using numbers, pronumerals and relations.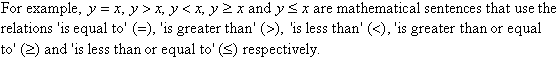
Consider the following sentence:
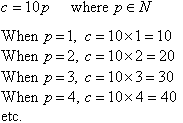
The cost (in dollars) of buying pens is equal to ten times the number of pens bought.
If c represents the cost in dollars and p represents the number of pens bought, then this sentence can be expressed mathematically as


This suggests the following definition:
A relation is a set of ordered pairs, and is usually defined by a rule.

Domain
The domain of a relation is the set of all first elements (usually x values) of its ordered pairs.

Range
The range of a relation is the set of all second elements (usually y values) of its ordered pairs.

Note:
The graph of c against p is discrete because p is an element of the set of natural numbers. The values of c depend upon p. So, we say that p is anindependent variable and c is a dependent variable.
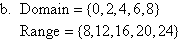
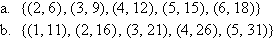
Example 1
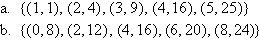
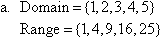
State the domain and range of the following relations:
Solution:
Functions
A relation is said to be a function if each element of the domain determines exactly one element of the range.

Domain of a Function
The domain of a function is the set of all first elements (usually x values) of its ordered pairs.

Range of a Function
The range of a function is the set of all second elements (usually y values) of its ordered pairs.

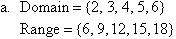
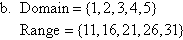
Example 2
State the domain and range of the following functions:
Solution:
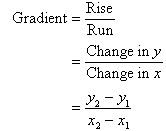
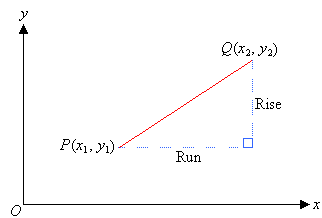
Gradient of a Straight Line
|
The gradient of a straight line is the rate at which the line rises (or falls) vertically for every unit across to the right.
That is: |
|  |
Note:
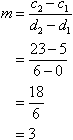
The gradient of a straight line is denoted by m where:

Example 3
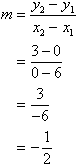
Find the gradient of the straight line joining the points P(– 4, 5) and Q(4, 17).
|
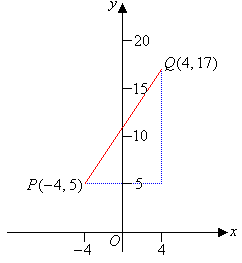
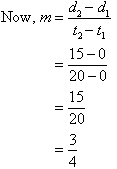
Solution:
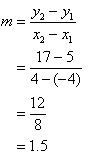
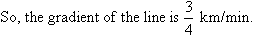
So, the gradient of the line PQ is 1.5. |
|
Note:
If the gradient of a line is positive, then the line slopes upward as the value of x increases.
Example 4
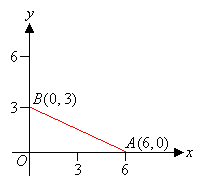
Find the gradient of the straight line joining the points A(6, 0) and B(0, 3). |
Solution:

   |
|
Note:
If the gradient of a line is negative, then the line slopes downward as the value of x increases.
Applications of Gradients
Gradients are an important part of life. The roof of a house is built with a gradient to enable rain water to run down the roof. An aeroplane ascends at a particular gradient after take off, flies at a different gradient and descends at another gradient to safely land. Tennis courts, roads, football and cricket grounds are made with a gradient to assist drainage.
Example 5
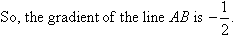
A horse gallops for 20 minutes and covers a distance of 15 km, as shown in the diagram.
Find the gradient of the line and describe its meaning.
Solution:

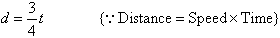
 In the above example, we notice that the gradient of the distance-time graph gives the speed (in kilometres per minute); and the distance covered by the horse can be represented by the equation: In the above example, we notice that the gradient of the distance-time graph gives the speed (in kilometres per minute); and the distance covered by the horse can be represented by the equation:
Example 6
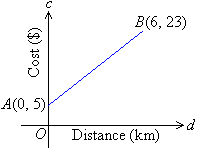
The cost of transporting documents by courier is given by the line segment drawn in the diagram. Find the gradient of the line segment; and describe its meaning.
Solution:

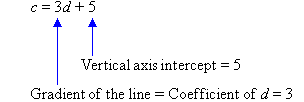
So, the gradient of the line is 3. This means that the cost of transporting documents is $3 per km plus a fixed charge of $5, i.e. it costs $5 for the courier to arrive and $3 for every kilometre travelled to deliver the documents.
Equation of a Straight Line
|
To establish a rule for the equation of a straight line, consider the previous example.An increase in distance by 1 km results in an increase in cost of $3. We say that the rate of change of cost with respect to distance is $3 per kilometre.
The information given in the graph can be represented by the equation c = 5 + 3d. That is:
In general:
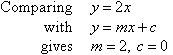
A line with equation y = mx + c has gradient m and y-intercept c.
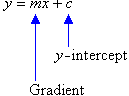
The gradient of a straight line is the coefficient of x.
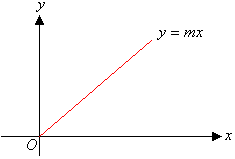
Particular Case
If a straight line passes through the origin, then its y-intercept is 0. So, the equation of a straight line passing through the origin is
y = mx
where m is the gradient of the line.
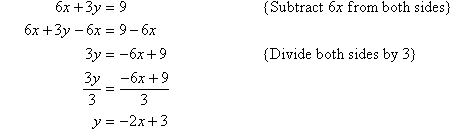
Example 7
Solution:


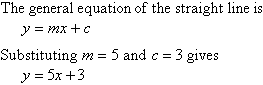
Example 8
Write down the equation of the straight line that has m = 5 and c = 3.
Solution:
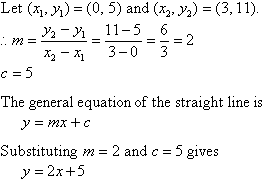
Example 9
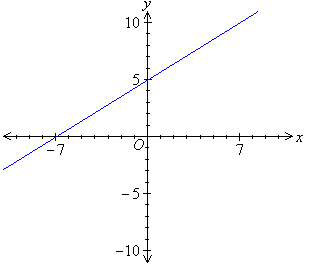
Calculate the gradient of the straight line given in the following diagram; and find its equation.
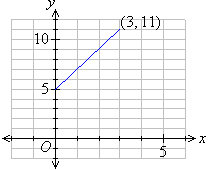
Solution:
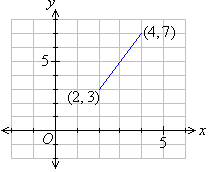
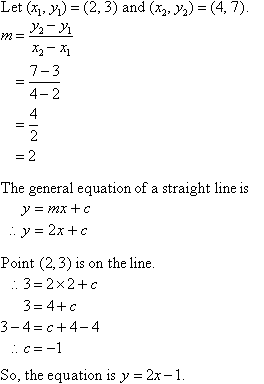
Example 10
Find the equation of the line joining the points (2, 3) and (4,7).
Solution:
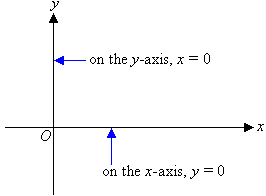
Often we need to know the general shape and location of a graph. In such cases, a sketch graph is drawn instead of plotting a number of points to obtain the graph.Two points are needed to obtain a straight line graph. It is simpler to find the points of intersection of the graph with the axes. These points are called thex- and y- intercepts.
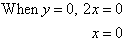
x-intercept:
The y-coordinate of any point on the x-axis is 0. Therefore to find the x-intercept we put y = 0 in the equation and solve it for x.
y-intercept:
The x-coordinate of any point on the y-axis is 0. Therefore to find the y-intercept we put x = 0 in the equation and solve it for y.
 |
Example 11
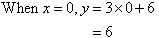
Sketch the graph of y = 3x + 6.
Solution:
|
y = 3x + 6x-intercept:
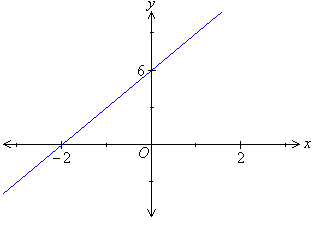 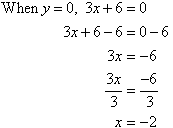
y-intercept:
 |
|
Note:
We often represent the gradient and the y-intercept of the straight line by m and c respectively.
In the previous example:
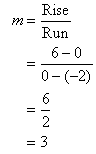
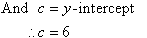
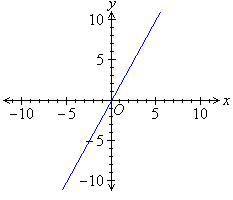
From the ongoing discussion we can infer that y = 3x + 6 is a straight line with a gradient of 3 and y-intercept of 6.
In the example under consideration, the gradient of the straight line is positive. So, the straight line slopes upward as the value of x increases. |
Example 12
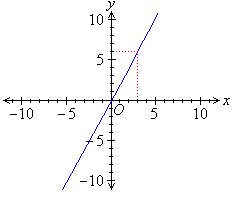
Sketch the graph of y = –2x + 4.
Solution:
|
y = –2x + 4
x-intercept:
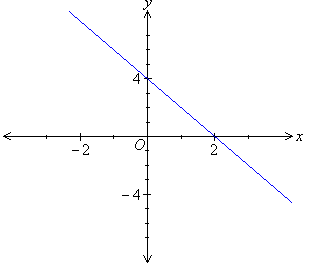
y-intercept:
 | |
Note:
From the ongoing discussion we find that the linear function y = –2x + 4 represents the equation of a straight line with a gradient of –2 and y-intercept of 4.
In the example under consideration, the gradient of the straight line is negative. So, the straight line slopes downward as the value of x increases.
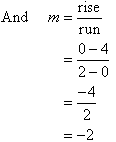
Example 13
Sketch the graph of y = 2x.
Solution:
|
y = 2xx-intercept:
y-intercept:
When x = 0, y = 0. |
|
As both the x- and y- intercepts are (0, 0), another point is needed.
We find when x = 5, y = 10. So, (5, 10) is an example of another point that can be used to form the straight line graph.
Alternative technique:
Use the gradient-intercept method:
So, the straight line passes through (0, 0). Use this point to draw a line of slope 2 (i.e. go across 3 units and up 6 units).
Note:
It is simpler to find the run and rise if we start from the y-intercept.
Example 14
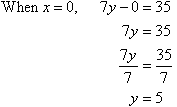
Sketch the graph of 7y – 5x = 35.
Solution:
|
7y – 5x = 35
x-intercept:
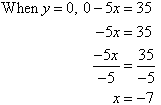
y-intercept:
A horizontal line is parallel to the x-axis, as shown in the following diagram.
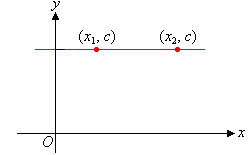
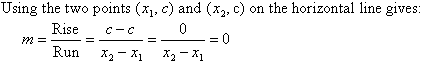
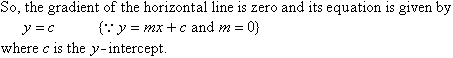
Note:
The value of the y-coordinate on a horizontal line is always equal to c, the y-intercept.
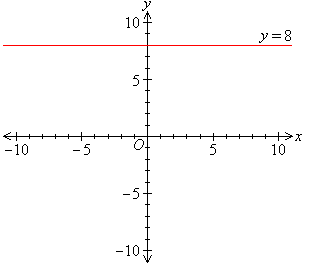
Example 15
Sketch the graph of y = 8.
Solution:
A vertical line is parallel to the y-axis, as shown in the following diagram.
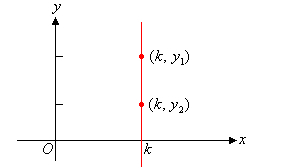
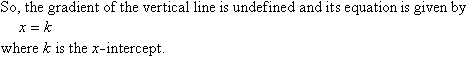
Note:
The value of the x-coordinate on a vertical line is always equal to k, the x-intercept.
Example 16
Sketch the graph of x = 8.
Solution:
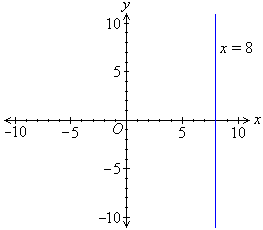 |
|
|
|
|
|
|
No comments:
Post a Comment